Dashboard v2 — "civitas top" (v0.9.1)¶
Status: ✅ ACCEPTED, fully implemented (Phases A–G). PRD + design ratified in conversation
(2026-07); Mockup B (dense three-pane grid) chosen over Mockup A after building and comparing both
as real, runnable Textual apps (§7.0); auth/write-actions/telemetry-dashboard deliberately deferred
to v0.9.2 (§12, docs/milestones.md). Implementation plan: .sisyphus/plans/dashboard-v2.md.
1. Problem¶
civitas dashboard (M3.3) starts its own Runtime in-process, wires a MetricsCollector
directly, and renders with Rich's static Live. It cannot attach to a topology already running
elsewhere, has no resource visibility, and its LLM/cost metrics have been silently dead since
M3.3 shipped (FD-01, docs/milestones.md: "llm_call is not auto-wired... a real follow-up, not
silently claimed done"). This is that follow-up, plus a full rebuild on TopologyServer (the
remote-attach surface civitas topology show already uses) and a move to Textual for real
interactivity — mouse, scrolling, click-to-focus. PRD (agreed in conversation, not reproduced
in full here): P0 for v0.9.1 is topology + per-agent health/LLM-metrics + per-process resources;
P1 (network I/O, session length, history/sparklines, write actions) and P2 (log tail,
multi-cluster) are explicitly deferred to v0.9.2.
2. Architecture¶
┌─────────────────────┐        HTTP (poll, N Hz)        ┌──────────────────────────┐
│  civitas dashboard   │ ──────────────────────────────► │   TopologyServer         │
│  (Textual App,       │ ◄────────────────────────────── │   (inside Runtime's OS   │
│   separate process)  │   /topology /agents /metrics     │    process, supervised)  │
└─────────────────────┘        /processes                └──────────┬───────────────┘
                                                                     │ same-process reads
                                                        ┌────────────┼─────────────┐
                                                        │            │             │
                                                  Supervisor    MetricsCollector  psutil
                                                  tree (D6      (agent metrics)   (Runtime's
                                                  introspection)                  own PID)
                                                                     │
                                                          _agency.health_probe (D5, reused)
                                                                     │
                                                                     ▼
                                                        ┌──────────────────────────┐
                                                        │   Worker process(es)     │
                                                        │   psutil (own PID) in    │
                                                        │   the existing health-   │
                                                        │   ack reply             │
                                                        └──────────────────────────┘
Same discovery mechanism civitas topology show already uses (find the topology_server node
in the YAML → host:port), but the dashboard polls continuously instead of once, with a
visible "reconnecting…" state instead of one-shot fallback-to-static.
3. TopologyServer changes¶
3.1 Enrich /topology and /agents (D-DASH-1)¶
_serialize_node's Supervisor branch and _build_agents_list/_build_agent_detail currently
emit only name/type/status. Add, for every node, straight off attributes TopologyServer
already has a reference to (no bus round-trip — same pattern as Phase C's _status_snapshot()):
- restart_count (per child, from sup._restart_counts)
- crashes_in_window (from sup._engine.window occupancy, per Supervisor node)
- capabilities / capability_metadata (from AgentProcess.capabilities — this is the "agent
description" from the PRD; already exists, never surfaced)
- uptime_seconds (needs a new AgentProcess._incarnation_started_at timestamp, set in
_start_nowait() — does not exist today; a restart's fresh incarnation naturally resets it,
which is the correct semantic: "uptime" means this incarnation's age)
3.2 New GET /metrics endpoint (D-DASH-2)¶
Exposes a MetricsCollector snapshot. TopologyServer needs a reference to one — see §4.
Shape: {"agents": {name: {messages_handled, messages_sent, avg_latency_ms, restarts, errors,
tokens_in, tokens_out, cost_usd, last_model}}, "total_messages", "total_cost_usd", "uptime_seconds"}.
3.3 New GET /processes endpoint (D-DASH-3)¶
Reuses the D5 (v0.9.0) per-process health-probe wire protocol rather than inventing a new
one. Two sources:
- The Runtime's own process: TopologyServer runs inside it — a local psutil.Process()
self-measurement, no message needed.
- Each Worker process: TopologyServer finds every distinct health_channel in the registry
(the same field D5 added to RoutingEntry) and sends _agency.health_probe directly — the
exact message a Supervisor already sends for liveness. The Worker's existing _on_health_probe
handler gains cpu_percent / rss_bytes to its _agency.health_ack payload (its own
psutil.Process() self-measurement), additive to the existing per-agent snapshot — Supervisors
ignore fields they don't recognize, so this is a compatible extension, not a wire-format break.
Shape: {"processes": [{"kind": "runtime"|"worker", "id": ..., "pid", "cpu_percent",
"rss_bytes", "uptime_seconds"}]}.
4. MetricsCollector becomes remotely visible (D-DASH-4)¶
Runtime.start() auto-constructs a MetricsCollector (if the caller didn't already provide one
via the existing metrics= constructor kwarg) whenever the topology contains a
topology_server node, wires it via the existing set_metrics()/on_crash() path (unchanged),
and additionally hands the same reference to the TopologyServer instance
(topology_server._metrics_collector = collector) during the existing injection pass in
start() — the same place _root_supervisor/_agents already get set on it. Zero behavior
change for anyone not running a TopologyServer; existing Runtime(metrics=my_own_sink) callers
are unaffected (their sink is used as before; the dashboard-visible snapshot is simply unavailable
if their sink isn't a MetricsCollector, which is now explicitly documented rather than assumed).
5. Closing FD-01 — llm_span() actually feeds the collector (D-DASH-5)¶
MetricsSink (the formal protocol AgentProcess/Supervisor are written against) gains a new
method:
def llm_call(self, agent_name: str, tokens_in: int, tokens_out: int, cost_usd: float, model: str = "") -> None:
    """Record one LLM call's usage, cost, and model."""
This is an additive protocol change — worth a CHANGELOG callout since any external
MetricsSink implementation (Presidium-side, for example) now needs this method to satisfy the
@runtime_checkable protocol at the type level, though isinstance() checks at call sites stay
defensive (if self._metrics is not None: self._metrics.llm_call(...), same guard style already
used for message_handled).
llm_span()'s existing finally: block (after span.end()) reads back whatever the caller set
via span.set_attribute("civitas.llm.tokens_in"/"tokens_out"/"cost_usd", ...) — the convention
docs/observability.md already documents, previously read by nobody — and calls
self._metrics.llm_call(self.name, tokens_in, tokens_out, cost_usd, model=model) if a sink is
attached and at least one of the three attributes was actually set (an llm_span() that never
sets them costs nothing and reports nothing, rather than reporting a spurious all-zero call).
MetricsCollector.llm_call() gains the model parameter, storing last_model per agent.
6. Health color model (ratified: option A)¶
ProcessStatus |
Color | Notes |
|---|---|---|
RUNNING |
green | |
INITIALIZING / STOPPING |
yellow | transitional |
CRASHED |
red | |
SUSPENDED |
grey, or blue for a HITL approval wait | §18 (v0.9.4): a SuspendCategory distinguishes governance-pause/other (grey, unchanged) from a HITL approval wait (blue) — previously the same grey for both |
STOPPED |
grey (dim) | terminal, distinct dim shade from SUSPENDED in the actual TUI palette |
Elevated restart rate (crashes_in_window > 0 while status is RUNNING) renders as amber
text within an otherwise-green row — "recovering," not a separate ProcessStatus.
7. Textual TUI structure¶
New civitas/dashboard/app.py (Textual App subclass), replacing renderer.py's Rich-based
rendering (the module is retired, not extended — this is a rebuild, not a patch, per the
milestones item's own framing).
7.0 Layout decision (ratified 2026-07): dense three-pane grid¶
Two layouts were prototyped as real, runnable Textual apps with sample data (not just described)
and compared as rendered screenshots before choosing — source scripts kept at
.sisyphus/mockups/dashboard-mockup-{a-split,b-grid}.py (untracked, per .sisyphus/ convention);
rendered screenshots archived at docs/assets/dashboard-mockup-{a-split,b-grid}.svg.
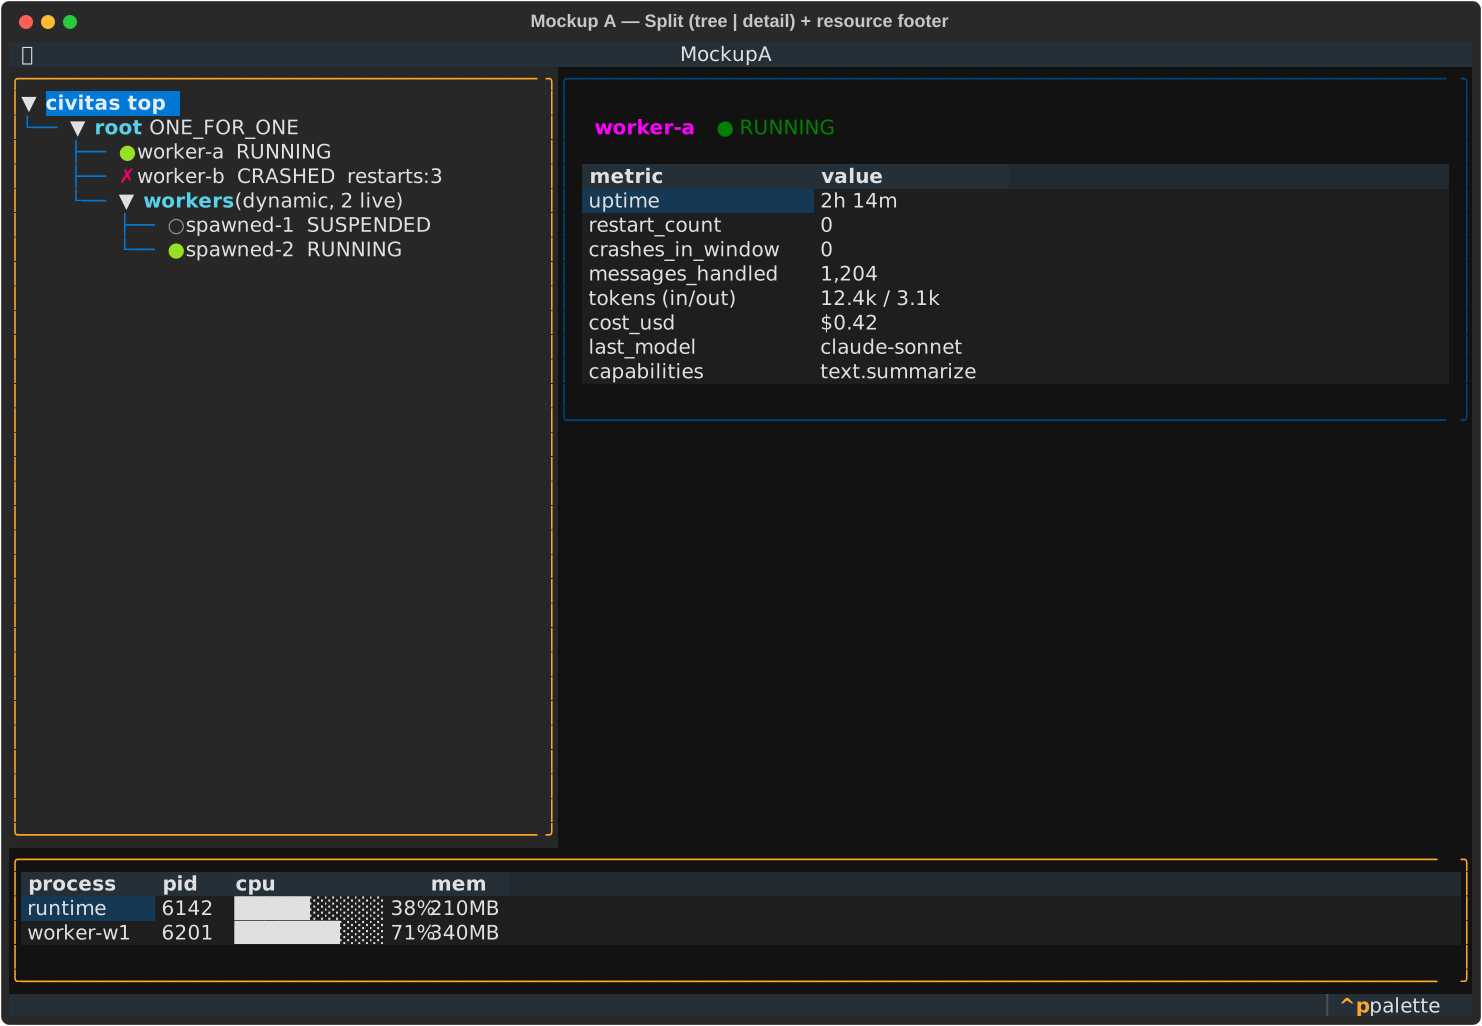
- Mockup A — Horizontal split (tree left ~38%, wide detail panel right ~62%, resource stats as a thin footer strip). Pro: more horizontal room for the detail table. Con: the resource footer reads as an afterthought, not a first-class panel, and the wide detail panel leaves a lot of dead vertical space on a real terminal (height varies far more than the 120×40 mockup size did).
- Mockup B — Dense three-pane grid (tree | detail | resources, roughly equal thirds, all visible simultaneously). Closer to btop/dolphie's density; treats topology, agent detail, and process resources as three EQUALLY first-class panels, matching the PRD's own framing rather than making one the "main" view and the others secondary.
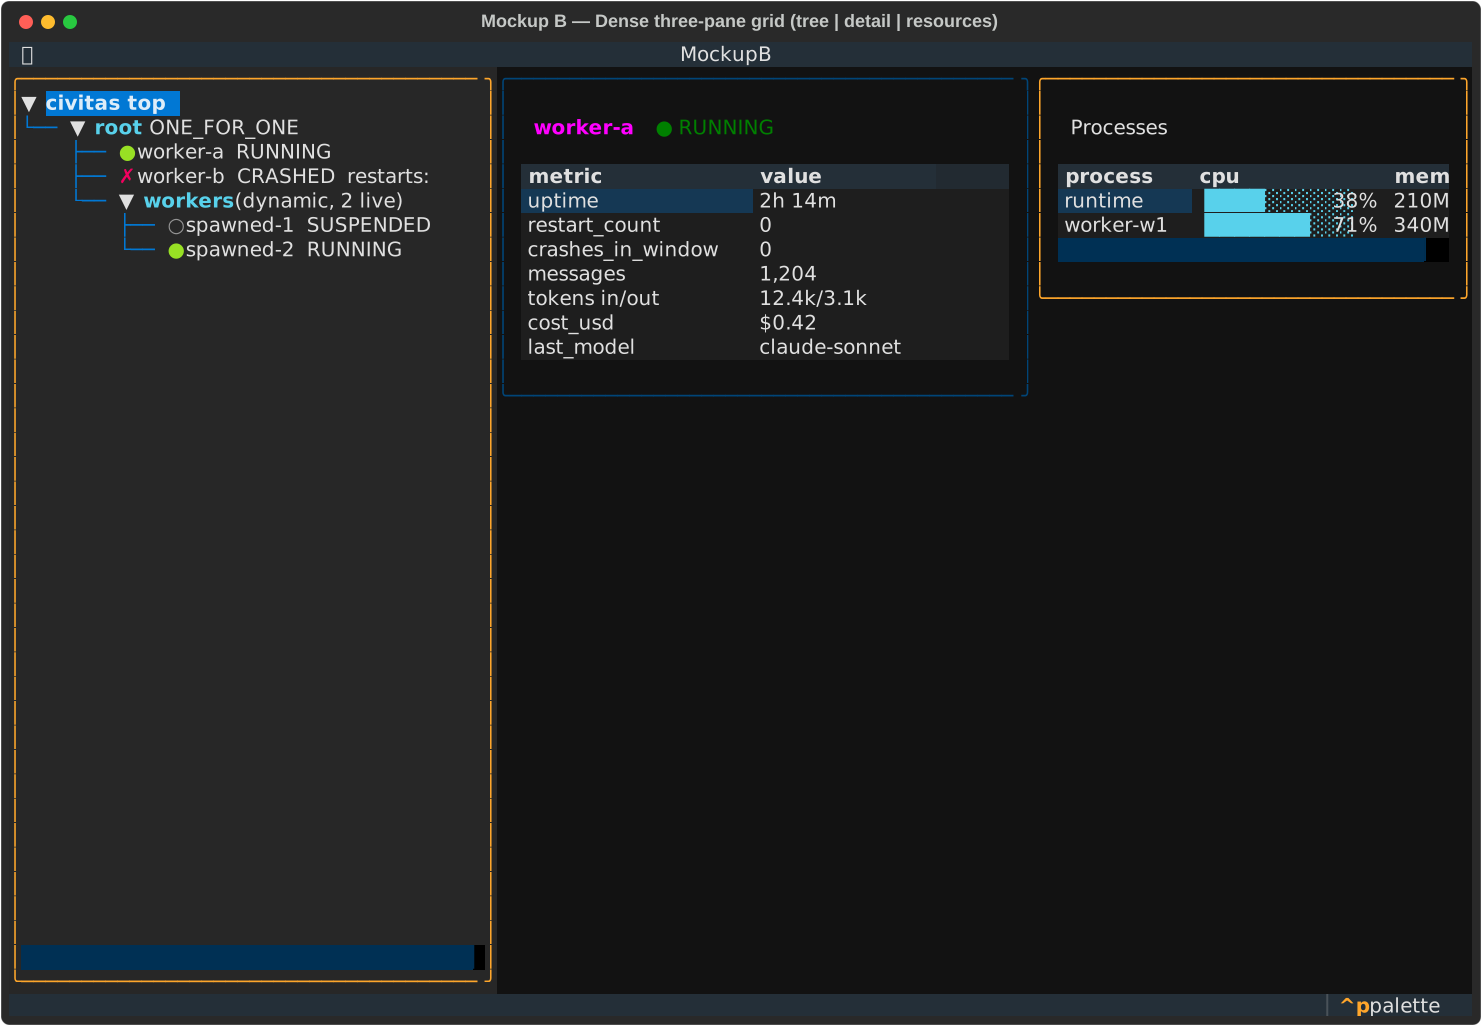
Ratified: Mockup B (dense three-pane grid) ships in v0.9.1. Mockup A's core idea — a wider
detail view — is not discarded: deferred to v0.9.2 as an optional focus/expand mode (e.g.
pressing Enter on a tree node temporarily widens the detail pane), rather than the default
layout. Tracked in docs/milestones.md v0.9.2.
TopologyTree(TextualTreewidget) — left pane, mouse-clickable nodes, click focuses the detail pane on that agent/supervisor.AgentDetailPanel(TextualDataTable/Staticcomposite) — middle pane: status color, capabilities, restart count, crash-window occupancy, uptime, messages/tokens/cost/last-model for the focused node.ProcessResourcePanel— right pane (not a footer, per the layout decision above): one row per OS process (Runtime + Workers), each with a proportional colored gauge bar for CPU% and RSS% (single-sample meter, gradient green→amber→red as it fills) alongside the raw numbers — this is a snapshot visualization, not a history chart (multi-sample time-series graphs stay P1/v0.9.2 per the PRD; a proportional bar from one reading is in scope now).- Polling worker: a Textual
@workbackground task per endpoint (/topology,/metrics,/processes), interval from the existing--refreshflag, each independently retried on failure with a visible "reconnecting…" banner instead of the whole app dying — mirrorstopology show's graceful-unreachable framing, but persistent instead of one-shot. - Mouse support and scrolling are Textual defaults, not custom code — the framework does this.
7.1 Visual design language (ratified: rich and colorful, not excessive)¶
Reference points: btop (gradient meter bars, confident color-per-category use),
dolphie (a real, widely-used Textual dashboard — proof this aesthetic works cleanly in a
terminal, not just in GUI toolkits), and Textual's own dark-theme design-token system
($primary/$secondary/$success/$warning/$error/$accent), which the app defines against
rather than hardcoding ANSI colors — free light/dark theme support later, and consistent color
semantics across every widget.
The guardrail for "not excessive": color always encodes meaning, never decoration. Concretely:
- One accent color per data category, used consistently everywhere that category appears: cyan/blue for topology/structure, violet/magenta for LLM+cost metrics, amber/gold for resource gauges, and the five status colors from §6 for health — never mixed (an agent's cost figure is always violet, never colored by its status; its status dot is always the §6 palette, never themed by category).
- Rounded panel borders (Textual
border: round) with a colored title matching that panel's category accent — this alone is most of what makes btop/dolphie read as "modern" rather than a 1980s curses app, and it's near-zero extra code (a CSS property). - One glyph vocabulary, reused, not reinvented per-widget — extends today's Rich renderer's
existing
_STATUS_DOTS(● ◐ ○ ✗ ?) with color from §6, plus▲/▼only where a real directional signal exists (e.g. cost trending up this session) — never decorative arrows with no underlying signal. - No blinking, no flashing, no more than the defined palette — a crashed agent's red is attention-grabbing because it's the only red in a mostly green/cyan/violet screen, not because it animates.
- Textual's CSS is a separate
.tcssfile (civitas/dashboard/app.tcss), not inline styles — keeps the visual language auditable/editable in one place instead of scattered through widget code.
8. New dependencies¶
textual and psutil, both under a new civitas[dashboard] extras group (not core), matching
every other optional-surface precedent in this repo (civitas[http], civitas[grpc], etc.).
civitas dashboard fails fast with a ConfigurationError + install instructions if the extra
isn't installed, matching connect_mcp()'s pattern for fabrica.
9. CLI change¶
civitas dashboard <topology.yaml> — YAML-driven discovery only (ratified), no --url flag.
Reuses _find_topology_server() from cli/topology.py (moved to a shared location, e.g.
cli/_topology_discovery.py, since two commands now need it). Refuses with a clear error if the
YAML declares no topology_server node — a dashboard needs something to attach to. The
"spawn-my-own-runtime" code path in today's dashboard.py is removed, not kept as a second
mode — the PRD's whole point is remote attach; keeping both would mean maintaining two mental
models for one command. --refresh (seconds) is kept, now meaning "poll interval" instead of
"Rich Live refresh rate."
10. Testing strategy¶
TopologyServerendpoint changes: plain unit tests (JSON shape assertions), no Textual needed — matches how/topology//agentsare presumably tested today.MetricsCollector.llm_call()+llm_span()wiring: unit tests asserting a span withcivitas.llm.tokens_inetc. set produces exactly onellm_call()invocation with the right values; a span that never sets them produces zero calls (no spurious zero-cost entries).psutil-based process stats: unit tests withpsutil.Processmocked (no real process introspection needed to prove the wiring is correct); one real (un-mocked) smoke test thatpsutil.Process(os.getpid())returns sane values, guarding against API drift.- The
_agency.health_probe/_agency.health_ackextension: extend the existingtests/integration/test_process_liveness.pyreal-ZMQ suite (same file D5 already lives in) with an assertion thatcpu_percent/rss_bytesarrive in the ack. - Textual App itself:
textual.testing.Pilot(bundled test harness) drives simulated key/mouse events and asserts rendered state — used for the handful of interaction tests that matter (click-to-focus, reconnect-banner-on-failure), not exhaustively for every widget.
11. Compatibility & behavior-change ledger¶
| Change | Kind | Notes |
|---|---|---|
MetricsSink.llm_call() |
Additive protocol change | external sink implementers need this method now |
MetricsCollector.message_handled()/message_sent()/agent_error()/agent_restarted()/llm_call() |
Behavior change | previously silently ignored an unregistered agent name; now self-register lazily on first event — fixes dynamically-spawned children, has no effect on any existing caller that already registered first |
TopologyServer /topology//agents response shape |
Additive | new fields, existing fields unchanged |
New /metrics, /processes endpoints |
Additive | |
_agency.health_ack payload |
Additive | new cpu_percent/rss_bytes fields, existing fields unchanged |
civitas dashboard CLI |
Breaking (CLI only) | no longer spawns its own Runtime; requires a topology_server node in the YAML and a separately-running process to attach to |
civitas/dashboard/renderer.py |
Removed | superseded by civitas/dashboard/app.py (Textual) |
New extras: civitas[dashboard] |
Additive | textual, psutil |
12. Open items carried to implementation (not blocking sign-off)¶
- ~~Whether
uptime_secondsneeds a new_incarnation_started_atfield~~ Resolved (Phase A): confirmed no existing per-incarnation timestamp existed; addedAgentProcess._incarnation_started_at(set fresh in_start_nowait(), so D1a's fresh-instance restart resets it automatically — zero special-casing needed) + a publicuptime_secondsproperty. - Cross-platform scope, raised mid-Phase-D-planning (2026-07-24): the product targets macOS
and Windows in addition to Linux, but CI has only ever run
ubuntu-latestand this whole arc's manual verification has only ever covered macOS + Linux (Docker). Fixing full CI coverage is out of scope for this design (tracked as its own backlog item,docs/milestones.mdv0.9.2). What IS in scope here: not making it WORSE — Phase D's new tests usetcp://127.0.0.1:<port>rather than theipc://(Unix-only) pattern 4 existing test files use, and itspsutilusage is written defensively rather than assuming Linux-only behavior. None of this is Windows-VERIFIED (no Windows runner available in this environment) — it's Windows-AWARE, which is a real, honest distinction worth keeping straight.
Phase A implementation notes (D-DASH-1, done)¶
restart_countattribution is per-child, computed by the PARENT — a node cannot know its own restart count, only the supervisor tracking it can._serialize_nodegained arestart_countparameter the parent supplies for each child it recurses into (root defaults to 0, no parent to track it). Caught via a dedicated test (test_serialize_supervisor_children_get_own_restart_count) proving two children's counts aren't conflated — the bug a naive "sum at the parent" version would have introduced (an early draft of this implementation did exactly that before catching it).- Found and fixed a pre-existing, unrelated test flake while in this file:
TestTopologyShowCommand::
  test_show_fallback_when_runtime_not_running
asserted an un-normalized substring against Rich's word-wrapped CLI output — passed on macOS, failed on Linux/Docker (narrower default terminal width wraps the phrase mid-string). Same class of bug as V1 (v0.8.1, Rich help-text width). Confirmed pre-existing (reproduces identically without any Phase A changes) before fixing; normalized whitespace before the substring check.
Phase B implementation notes (D-DASH-2/D-DASH-4, done)¶
MetricsCollector.register_agent()is required before any metric records anything —message_handled()/message_sent()/etc. all silently no-op for an unregistered name (a pre-existingMetricsCollectorbehavior, not new). The old CLIdashboard.pycalledregister_agent()manually for every static agent at startup;Runtime's new auto-provisioning reproduces this loop. Caught by a real end-to-end test (not assumed) — the first draft oftest_topology_server_http_metrics_shapefailed with an emptyagentsdict until this was added.- Resolved, same session (was briefly a documented gap): dynamically-spawned children (via
DynamicSupervisor) aren't known toall_agents()'s static snapshot, so a spawn-time registration hook looked like the obvious fix — but that chases a moving target for every future spawn mechanism too. The actual fix is structural:MetricsCollector's recording methods (message_handled/message_sent/agent_error/agent_restarted/llm_call) now self-register via a shared_agent()helper (dict.setdefault) instead of silently no-op'ing for an unknown name. A dynamically-spawned agent is tracked correctly from its FIRST reported event, no matter how or when it came to exist — zero new coupling betweenDynamicSupervisorand the collector.register_agent()is kept as a still-useful explicit call for agents you want visible with all-zero metrics before their first activity (what the static-registration loop does) — no longer a requirement for correctness. Deliberate behavior change from the pre-v0.9.1 "operations on an unregistered agent are silently ignored" contract, verified end-to-end (test_topology_server_http_metrics_includes_dynamically_spawned_agent: realDynamicSupervisor, real spawn, real/metricsresponse) — not just at the unit level. Status was never actually part of this gap — confirmed by tracing every call site ofagent_status_changed(): it was ONLY ever called from the old CLIdashboard.py's manual polling loop, never fromRuntime/AgentProcess/Supervisor.TopologyServer's/topologyand/agents(Phase A) readagent.status.valuedirectly off the LIVE tree on every request — status for dynamic children was already correct with zeroMetricsCollectorinvolvement. build_component_set()capturesself._metricsby value, so the auto-provisioning block must run strictly before it — placed at the very top ofstart(), before theComponentSetbranch, not alongside the laterTopologyServerreference-injection block (which was the first, wrong, instinct — caught by re-reading the existing code path before writing code, not by a failing test).
Phase C implementation notes (D-DASH-5, closes FD-01, done)¶
- Metrics reporting had to move OUTSIDE the
if self._tracer is not None:branch — the originalllm_span()returned early for the no-tracer case, meaning a dashboard-only setup (metrics attached, no OTEL tracer configured) would have silently gotten zero cost/token tracking even after this phase, an easy trap to fall into if the restructure had been a minimal patch rather than a real look at the control flow. Restructured so both branches (tracer / no-tracer) build a realSpan(the class already "works with or without OTEL" per its own docstring) and share onefinally:block that reports to the metrics sink regardless. has_tracer: boolis a separate local fromself._tracer is not Nonespecifically so mypy can be told, via oneassert, thatself._traceris non-Noneinside that branch — checking a boolean alias doesn't narrow the original attribute's type on its own.- Considered a defensive
getattr(self._metrics, "llm_call", None)guard for callers with an old customMetricsSinkthat predates this protocol addition, then rejected it — every otherMetricsSinkcall site in this file (message_handled/message_sent/agent_error) calls directly, trusting the Protocol contract with no such guard. Matching that convention rather than introducing a one-off exception for this call site. MetricsCollector.llm_call()'smodelparameter only overwriteslast_modelwhen non-empty — a later call that doesn't report a model (or an agent using multiple providers where one call doesn't tag it) shouldn't blank out the last known-real value.
Phase D implementation notes (D-DASH-3, done)¶
_route_httphad to becomeasync— it was a plain sync dispatch table (no route needed real I/O before this phase);/processesneeds toawaitbus round-trips to remote Workers. Every other route stays a synchronous call within the now-async method — unaffected behavior, just a signature change (tests/unit/test_topology_server.py's direct_route_http(...)calls neededawaitadded, mechanical).- A real deadlock, caught by actually running the integration test, not by review: the first
draft of the real-ZMQ end-to-end test used
urllib.request.urlopen()inside anasync deftest — a BLOCKING call that starves the very event loop theTopologyServer(client and server share one process/loop in this test) needs to run on to answer the request. The test hung until its own socket timeout fired, with no useful error pointing at the cause. Root-caused by testing_build_processes()directly first (proved it returns correctly in milliseconds, ruling out the new endpoint logic) before suspecting the HTTP client. Fixed by using the same asyncasyncio.open_connection()-based helpertest_topology_server.py's own tests already use — this codebase had already solved this exact problem once; the fix was to reuse it, not invent a second one. - A real routing race, also caught by the same test, not assumed away:
_probe_worker_processonly caughtTimeoutError, but a Worker's health channel can be announced moments AFTER the agent it hosts (same startup loop, separate messages) — probing in that narrow window raisesMessageRoutingError, which propagated uncaught through_build_processes()and_handle_connection's top-levelexcept Exception: pass, silently killing the ENTIRE/processesresponse (not just the one racing Worker's entry). Fixed by catchingMessageRoutingErroralongsideTimeoutError(both mean "not answerable right now, omit this one entry") plus a broad finalexcept Exceptionso one bad channel can never take down every other process's data in the same response (F03-7 containment, matching this codebase's existing convention for background/reporting paths). psutilneeded a[[tool.mypy.overrides]] ignore_missing_importsentry (no bundled type stubs), added to the same override listzmq/nats/etc. already share.
Post-Phase-D addendum: process_id linkage + restart_history (2026-07-26, done)¶
Two small, safe, read-only additions agreed during the capability-scope discussion (kept out of the control-plane/auth-gated group entirely — these add no write surface, no new risk tier):
process_idon every serialized agent/supervisor node (/topology,/agents,/agents/{name}) — matches one of/processes' ownidfields exactly (a Worker'shealth_channelfor remote agents, thisTopologyServer's own name for everything else), so a client can join the two endpoints directly. Verified end-to-end (not just the_process_id_for()unit contract): a real agent's/topologyprocess_idis asserted to be literally present in a real/processesresponse's set ofids.restart_historyin/metrics—MetricsCollector.restart_history(a list of timestampedRestartEvents) had existed since M3.3 and was never exposed via this endpoint. Free, already- collected data.- Found a second dead metrics hook while wiring the second one in —
agent_restarted()existed onMetricsSink/MetricsCollectorand was fully unit-tested, but was never called from anywhere incivitas/— the exact same shape of gap FD-01 was forllm_call()(Phase C). The old CLIdashboard.pywas the only caller, wired manually viaRuntime.on_crash(). Reproduced that wiring in the same auto-provisioning block Phase B added, sorestart_historyand per-agent restart-count accuracy work for ANYTopologyServer-havingRuntime, not only the (Phase F-removed) standalone CLI path. Caught by writing the real end-to-end test first (a genuine crash-restart, not a mock) and watching it fail with an empty list — not assumed correct because the field existed in the schema.
Phase E implementation notes (Textual app itself, done)¶
civitas/dashboard/{client.py,palette.py,widgets.py,app.py,app.tcss}, replacing
civitas/dashboard/renderer.py (deleted) and civitas/cli/dashboard.py (rewritten to §9's
YAML-driven-discovery-only shape — folded into this phase rather than left broken, since deleting
renderer.py made the old CLI non-functional; _find_topology_server moved to the shared
civitas/cli/_topology_discovery.py §9 already specified). Mockup B's dense three-pane grid
shipped as designed. Six real bugs found by actually running the app (Pilot-driven integration
tests plus a manual smoke run against a live Runtime per §10's mandate), not by review:
$tokenmarkup fails insideTree/DataTablecontent. Textual's theme-variable syntax ($accent,$success, etc.) only resolves through Textual's ownContentrenderer, whichStatic.update()uses —Tree.add()/add_leaf()andDataTable's cell formatter both use plain RichText.from_markup(), which raisesMarkupErroron an unrecognized$name. Fixed by revertingSTATUS_COLORSand the category-accent constants to plain, real Rich color names (exactly what the retiredrenderer.pyalready used) for anything rendered into a Tree label or DataTable cell;$tokensremain valid and used in.tcssand the oneStatic-only banner.TopologyTree._add_nodesilently shadowedTree's own private_add_node. Same class of bug as v0.9.0's D-E4-6 — crashed on construction of everyTopologyTreewith a signature mismatch. Renamed to_add_topology_node.ReconnectBanner's hidden-by-default state depended entirely onapp.tcss'sdisplay: noneand had no Python-level default — correct in the full app, broken in an isolated widget test with no app CSS loaded. Setself.display = Falseexplicitly in__init__too (defense-in-depth, not redundant: a widget's own default state shouldn't depend entirely on external CSS being present).- A naive "clear the shared reconnect banner on any successful poll" is a real race with three
concurrent pollers — a healthy
/metricsfetch could silently mask an ongoing/processesoutage. Fixed with aself._failing: set[str]tracked across all three pollers; the banner only clears when the set is empty, and names every currently-failing endpoint otherwise. @work(exclusive=True)with no explicitgroup=defaults every decorated method to the SAME"default"group —exclusive=Truecancels the previous worker in a group when a new one starts, so all three pollers fought over one group and only the last-called one (_poll_processes) ever actually ran;/topologyand/metricssilently never polled at all, with no exception, nothing visible except a permanently-empty tree. Found by directly inspectingapp.workersin a live run, not by a test assertion (the failure produced no error to catch). Fixed with an explicit distinctgroup=per poller.- Polling
@worktasks can outliverun_test()'s teardown and resume into an already-unmounted Screen, raisingNoMatchesand crashing the worker (whichrun_test()re-raises, failing the test). Fixed with anApp.is_runningcheck (_touch_dom()) before every DOM query inside a poller callback or the_mark_ok/_mark_failedhelpers, closing the window instead of adding a try/except at every call site. - Manual smoke run (§10's mandatory look-at-it pass) against a real live Runtime found two
more, non-crashing but real UX defects no automated test would catch: (1)
AgentDetailPanelandProcessResourcePanel(bothStaticsubclasses, defaultheight: auto) didn't fill their column the wayTopologyTree(aTree, which defaults to filling) did — fixed with explicitheight: 1fron all three panes inapp.tcss; (2) a 4th "uptime" column on the resource table overflowed a ⅓-width pane at realistic sizes and truncated the mem column — dropped back to Mockup B's original 3 columns (process/cpu/mem); uptime remains visible per-agent in the detail panel, so no information is lost, just not duplicated.
civitas/cli/dashboard.py's import of the optional dashboard extra was moved from
civitas/cli/__init__.py's module-level guarded import into the command function itself, raising
ConfigurationError with install instructions on invoke (matching connect_mcp()'s established
pattern) — a real UX improvement over the old guard, which hid the whole dashboard command from
--help if the extra wasn't installed; now the command always appears, only failing when actually
run without the extra. tests/integration/test_m3_3_dashboard.py::test_dashboard_command_registered
was updated for the new positional-argument CLI shape (§9's documented, intentional behavior
change) and made robust to typer's genuinely-unpinned (>=0.12) version range after a real
Docker/Linux run resolved a newer typer that renders argument metavars differently.
1373/1373 unit+integration green (macOS); all green on Linux (Docker, dashboard + full extras
installed) except the one confirmed pre-existing .venv-path environmental failure. mypy/ruff
check/format all clean. Manual smoke run against a real live Runtime confirmed correct rendering,
live data, and click-to-focus end-to-end (screenshot on file, not committed — ephemeral smoke
artifact, not a design record like the Mockup A/B comparison was).
Proceeding to Phase F (CLI — already substantially done as part of this phase's renderer.py removal) and Phase G (final verification sweep + docs + CHANGELOG + release choreography).
13. Addendum (v0.9.3, A2) — /metrics renamed to /snapshot¶
Deviation from §3.2's original design, recorded per this project's convention that any design deviation during implementation gets an addendum here, not a silent divergence.
§3.2 specified GET /metrics as TopologyServer's new JSON metrics-snapshot endpoint, which
shipped exactly as designed in v0.9.1. During v0.9.3 (real Prometheus text-format exposition,
see docs/milestones.md), that path collided with the Prometheus ecosystem's own hard convention:
virtually every Prometheus deployment defaults its scrape target to a bare /metrics with no
metrics_path override. Explicit decision (2026-07-29): honor the ecosystem standard rather than
pick a non-standard Prometheus path ("never wise to break standards in OSS projects") —
civitas's own JSON snapshot moved to GET /snapshot (naming it directly after the underlying
RuntimeSnapshot dataclass it returns verbatim), freeing /metrics for real Prometheus text
exposition.
This is a breaking change to a documented, already-shipped endpoint. Updated everywhere: civitas
top's own polling client (civitas/dashboard/app.py), docs/cli.md, docs/observability.md
(new "Prometheus metrics" section), and every test exercising the old JSON shape at /metrics
(now /snapshot) plus new tests for the new /metrics (Prometheus) behavior — see
tests/unit/test_topology_server.py and the new tests/unit/test_prometheus_export.py.
A second, unplanned finding surfaced live while verifying the new route against a real Prometheus
server: MetricsCollector.agent_status_changed() (present since v0.9.1) had never actually been
called from anywhere in the runtime — a plainly-running agent's exposed status came back
"unknown" forever. Fixed by routing every AgentProcess status transition through a single new
choke point (_set_status() in civitas/process.py), guarded so a user-supplied custom
MetricsSink that only implements the required Protocol methods (agent_status_changed was
never part of that Protocol) keeps working unchanged.
14. §7.0's deferred focus/expand mode — shipped (v0.9.4)¶
Mockup A's core idea (a wider detail pane), deferred at v0.9.1 sign-off as an opt-in mode rather
than the default layout, shipped in v0.9.4. Implementation detail worth recording: §7.0's own
illustrative text ("e.g. pressing Enter on a tree node") turned out not to be directly
implementable as originally phrased — confirmed by reading Textual's Tree.NodeSelected event
source, which carries no information about which input method (mouse click vs Enter key)
triggered it, so there's no reliable way to distinguish "select" from "select AND expand" through
that one event alone. Shipped instead as a dedicated f keybinding toggling a CSS class on
#main, which resizes AgentDetailPanel from 1fr to 3fr at the expense of the other two
panes (which shrink to 1fr each but stay fully visible — Mockup B's "three equally first-class
panels" philosophy holds even while focused; this expands the detail pane, it doesn't replace the
layout). No-ops with nothing selected yet. Verified via real measured widget widths in a headless
Textual test (tests/integration/test_dashboard_app.py), not just the CSS class flag being set.
15. P2's deferred multi-cluster view — shipped (v0.9.4)¶
civitas dashboard now accepts multiple topology files, each attached to and polled
concurrently, switchable via tabs. Required extracting the per-cluster three-pane-view-plus-
poll-workers logic that used to live directly on CivitasDashboardApp into a new, independently
reusable ClusterView widget — the app hosts N of these inside a TabbedContent when multiple
topologies are given, or exactly one directly (byte-for-byte unchanged single-cluster DOM shape
and behavior) when only one is given.
Two Textual mechanics were confirmed empirically, with small standalone scripts, BEFORE committing to this refactor shape, not assumed:
- A widget's own
query_one()scopes correctly to its own subtree, even with sibling instances sharing identical child IDs (e.g. twoClusterViews each containing their own#mainHorizontal) — this is what makes N independentClusterViewinstances safe to host side-by-side without any ID-suffixing scheme. - A widget's own
BINDINGSdispatch correctly whenever ANY descendant currently has focus, not just the widget itself — confirmed the binding-resolution chain walks up from the focused widget through its ancestors, checking each level's ownBINDINGS. This is what letsClusterView's own "f" focus-toggle binding (§14) keep working unmodified after moving fromCivitasDashboardAppontoClusterViewitself.
One real, live-discovered gap found while verifying the second mechanic against the ACTUAL
multi-cluster composition (not the isolated test scripts above): TabbedContent's own internal
tab-selector bar (ContentTabs) grabs default keyboard focus when the app mounts — not any
tab's own content. Confirmed by inspecting app.focused directly during a real headless run: it
was ContentTabs(), not TopologyTree(), meaning ClusterView's "f" binding would have silently
never fired in multi-cluster mode (nothing in that focus chain includes ClusterView as an
ancestor). Fixed by handling TabbedContent.TabActivated at the App level and moving focus onto
the newly-active tab's own TopologyTree — fires for the initially-active tab too, not just
user-driven switches, closing both gaps with one handler.
Each ClusterView owns its own ReconnectBanner (not one shared banner disambiguated by cluster
name) — simpler mental model, avoids cross-cluster banner-text complexity, matches "a cluster's
own local health status" naturally. Tab labels are derived from each topology file's own name,
sanitized to a safe widget-ID character set, with a numeric suffix for the (unlikely but real)
case of two topology files sharing a stem. Verified against two REAL, concurrently-running
Runtime+TopologyServer processes (not two mocked endpoints) — confirmed genuine cross-cluster
data isolation (each ClusterView shows only its own topology's own agents, never a sibling's).
16. P1's deferred "session length" — shipped (v0.9.4)¶
Defined and scoped in conversation (2026-07-30) before any code, deliberately reusing an existing
precedent rather than inventing a new runtime primitive — this section's whole framing ("no auth
needed, no new design surface") ruled out a genuine explicit session concept, which is real,
separate, tracked future work instead (docs/milestones.md).
Definition: a "session" is THIS INCARNATION's LLM engagement — AgentProcess.session_turn_count
(how many LLM calls this incarnation has actually reported usage for) and
AgentProcess.session_duration_seconds (seconds since the first one), both plain instance
attributes reset in _start_nowait() alongside _incarnation_started_at, matching
uptime_seconds's own precedent exactly: a restart is a fresh instance, so a fresh session too —
a crash-and-recover genuinely interrupts whatever was happening, treating it as a new session is
more honest than pretending continuity across a restart.
Only counts real usage — wired into _report_llm_metrics()'s existing "nothing reported -> no
spurious entry" gate (FD-01's established discipline), so an llm_span() that never reports
tokens/cost produces neither a metrics call nor a counted turn. Deliberately does NOT reset on an
idle gap between calls (accepted simplification, not a gap to close — a real idle-timeout-based
boundary is part of the separate, tracked, cross-restart session_id concept below, not this
signal).
Exposed via /topology's existing _serialize_node() (same place uptime_seconds already is,
not routed through MetricsCollector at all — session tracking works with zero metrics sink
attached, confirmed by a dedicated test). Rendered in AgentDetailPanel as a "session" row
right after "uptime", only shown once session_turn_count > 0 (matching this panel's existing
"no spurious zero entry" discipline for optional fields like capabilities).
Verified end-to-end against a REAL running dashboard_demo (ChattyWorker's real periodic LLM
calls), not just unit-tested: civitas top's actual detail pane rendered ['session', '16 turns,
31s'] for a real live agent, confirmed via the headless Textual pilot reading the ACTUAL
DataTable rows, not a mock.
Tracked, NOT built here: an explicit, cross-restart session_id concept¶
During this conversation, a genuinely separate, bigger idea was raised and is worth tracking
properly rather than folding into this small signal: an explicit session_id with real
boundaries and continuation relationships across restarts — e.g. "session 2 continues session 1
after a crash-restart", or a session that ends on an idle timeout even without any restart at all.
See docs/milestones.md's dedicated tracked-idea entry for the full writeup — it's cross-cutting
(touches spans/telemetry, not just the dashboard), genuinely bigger than a "Low priority" cosmetic
signal, and deliberately NOT conflated with session_turn_count/session_duration_seconds above,
which remain the simple, always-derived, incarnation-scoped version.
17. P1's "network I/O per process" — investigated, declined (v0.9.4)¶
Investigated properly (empirically, on real systems) rather than assumed straightforward, and the conclusion is a deliberate decision NOT to build this — a different category from the HITL-wait item's "still blocked, waiting on a prerequisite": there is nothing to wait for here, the underlying capability doesn't exist affordably on any target platform.
Linux: /proc/<pid>/net/dev exists but is byte-for-byte IDENTICAL to system-wide
/proc/net/dev — confirmed directly in a real container, not assumed. It reflects the current
network NAMESPACE, not the process, for any process sharing the host's default namespace (the
normal, non-containerized case). Real per-process attribution needs eBPF tracing (root, kernel
support, genuinely complex tooling) or cgroup network accounting (not universally configured) —
no simple library call exists.
macOS: nettop -P -L 1 -x DOES produce real per-process bytes_in/bytes_out — confirmed by
actually running it and reading real data for real processes. But it's a private, undocumented CSV
format from an Apple system binary, not a public API — shelling out and parsing it is inherently
fragile (no stability contract across macOS versions), and it's macOS-only regardless.
Windows (reasoned from established Windows facts, not verified on a Windows machine — none available in this environment): no clean per-process network counter exists in the standard Performance Counter taxonomy either — network stats are per-NIC, not per-process; real attribution needs ETW (Event Tracing for Windows), genuinely complex and typically privileged.
Decision: every viable path requires at least one of root/elevated privileges,
heuristic/approximate packet-capture-based attribution, or shelling out to an undocumented
platform-specific CLI tool with no stability guarantee — none of which fits this project's lean-
dependency, no-OS-command-shelling-for-core-features philosophy (the existing resource panel's
cpu_percent/memory_info/create_time are genuinely cross-platform via psutil, with no such
trade-offs; this metric has no equivalent). Not built, not planned, tracked here as a real,
investigated "no" rather than a silently dropped backlog item.
18. HITL-wait vs. governance-suspend: SuspendCategory (built, v0.9.4)¶
§6's table deferred this ("a distinct cyan HITL signal is explicit P1/v0.9.2, not built now") and
it was subsequently reclassified as blocked: suspend()/resume()'s reason was a free-form
string with zero structure, and the entire mechanism was designed for Presidium, a separate
external product, to populate meaningfully (see docs/design/civitas-presidium-boundary.md and
docs/design/durable-suspension.md) — civitas has no basis to invent a heuristic distinguishing
"governance pause" from "HITL approval wait" against a boundary that isn't this repo's to own.
Confirmed empirically before treating this as blocked: suspend()/resume() were exercised ONLY
in unit tests anywhere in this repo, zero real usage to design a signal against.
Unblocked by a civitas-side API, not an invented heuristic. AgentProcess.suspend() now takes
an additive category: SuspendCategory = SuspendCategory.OTHER parameter alongside the existing
free-form reason — civitas ships the mechanism (a structured, optional category), any real
caller (Presidium or otherwise) still owns the policy of what to send and when. Backward
compatible by construction: an existing caller passing only reason= lands in OTHER — today's
only category in effect — unaffected. Runtime.suspend() (the cross-process/by-name entry point)
and the _agency.suspend wire payload both carry the same additive category field (missing =
OTHER, so an older sender keeps working). A suspend_for_approval(reason: str = "") convenience
wrapper — "a subset of suspend/resume" — sets category=HITL_APPROVAL without the caller needing
to know the enum exists.
Color correction, caught before implementing, not after: the original PRD/§6 note called for
cyan, but §7.1's LATER-ratified category-color rule ("health colors never mixed with category
colors") had already reserved cyan as TOPOLOGY_ACCENT by the time this was built — using it here
would have violated that rule. Used blue instead (confirmed unused anywhere in the palette).
Persisted correctly, not just in-memory: category is written into the SAME durable suspend
marker dict _enter_suspended() already persists (alongside reason/since/approver), read
back via a new suspend_category property that reads the marker DIRECTLY — not a separate
in-memory attribute. This matters concretely: an approval pending across a crash/redeploy must
still render as "awaiting approval" after restore, not silently reset to grey. Found and
deliberately avoided repeating a related, pre-existing, harmless-today gap while building this:
self._suspend_reason (the in-memory attribute) is never actually synced back from the persisted
marker after _restore_state() — the new category field does not repeat that pattern.
Dashboard wiring: /topology's _serialize_node() (and its 4 sibling call sites) now expose
suspend_category for every agent node; civitas/dashboard/palette.py's status_color()/
status_markup() take an additive, optional suspend_category parameter that resolves to
HITL_ACCENT (blue) only when status == "suspended" and suspend_category == "hitl_approval";
TopologyTree's leaf labels and AgentDetailPanel's title both use it, and the detail panel gains
a suspended_because row (readable label, e.g. "awaiting approval (HITL)") shown only while
actually suspended.
Verified against real running infrastructure, not just unit tests: examples/dashboard_demo/
gained a genuine ApprovalWorker agent (self-suspends via suspend_for_approval() from within
handle(), auto-"approves" itself after ~20s purely for the demo). A real running instance's
/topology endpoint returned "suspend_category": "hitl_approval"; a real headless Textual pilot
confirmed the tree leaf's label carries a Span(..., 'blue'), the detail title renders
[blue]○ SUSPENDED[/], and the exported SVG screenshot contains the resolved hex fill #0000ff
— the actual rendered ink, not just the markup string.
Real finding while building the demo agent (not assumed): calling suspend_for_approval()
from a plain asyncio.create_task() background loop — the pattern every other demo agent in this
file uses — never actually transitions the agent. suspend() intentionally only takes effect at
the message loop's next boundary (S2, docs/design/durable-suspension.md), which only re-checks
when a message arrives; an agent idling with an empty mailbox never wakes up to notice. resume()
is NOT boundary-deferred (it transitions synchronously) so it remains safe to call directly from a
background task. The demo agent (and this doc) now records the correct shape: self-suspend via a
self-sent message consumed in handle(), matching the realistic HITL pattern of an agent deciding
mid-request that it needs approval before proceeding.